How to Build a Multiple Regression Model for NFL Totals Prediction
Introduction
Predicting NFL game totals is one of the most challenging yet rewarding aspects of sports analytics. Unlike picking winners, totals betting requires you to forecast the combined offensive and defensive performance of both teams - a complex interplay of pace, efficiency, weather, and game script that can make or break your bankroll. After years of watching "sure thing" unders turn into 70-point shootouts, I decided to build a systematic approach using multiple regression analysis.
In this tutorial, I'll walk you through building a comprehensive model that incorporates team statistics, environmental factors, and pace metrics to predict NFL totals. We'll use Parlay Savant to handle the heavy lifting of data collection and model building, but I'll be brutally honest about both the successes and spectacular failures along the way. By the end, you'll understand not just how to build these models, but why they're so difficult to get right and what realistic expectations you should have for sports prediction accuracy.
Step 1: Getting the Data with Parlay Savant
I started by prompting Parlay Savant to gather comprehensive game data that would serve as the foundation for our multiple regression model:
Get recent NFL game data with team stats and actual totals for model building. I need completed games from 2023 onwards with home/away team stats, actual point totals, weather data, and venue information. Include yards, plays, turnovers, and environmental factors.
Parlay Savant processed this request by generating a complex SQL query that joined multiple tables - games, teams, team_game_stats, and weather data. The query pulled 200 completed games with 22 different variables, creating a rich dataset for analysis. What impressed me was how it automatically handled the relationships between tables and included both offensive and defensive metrics for each team.
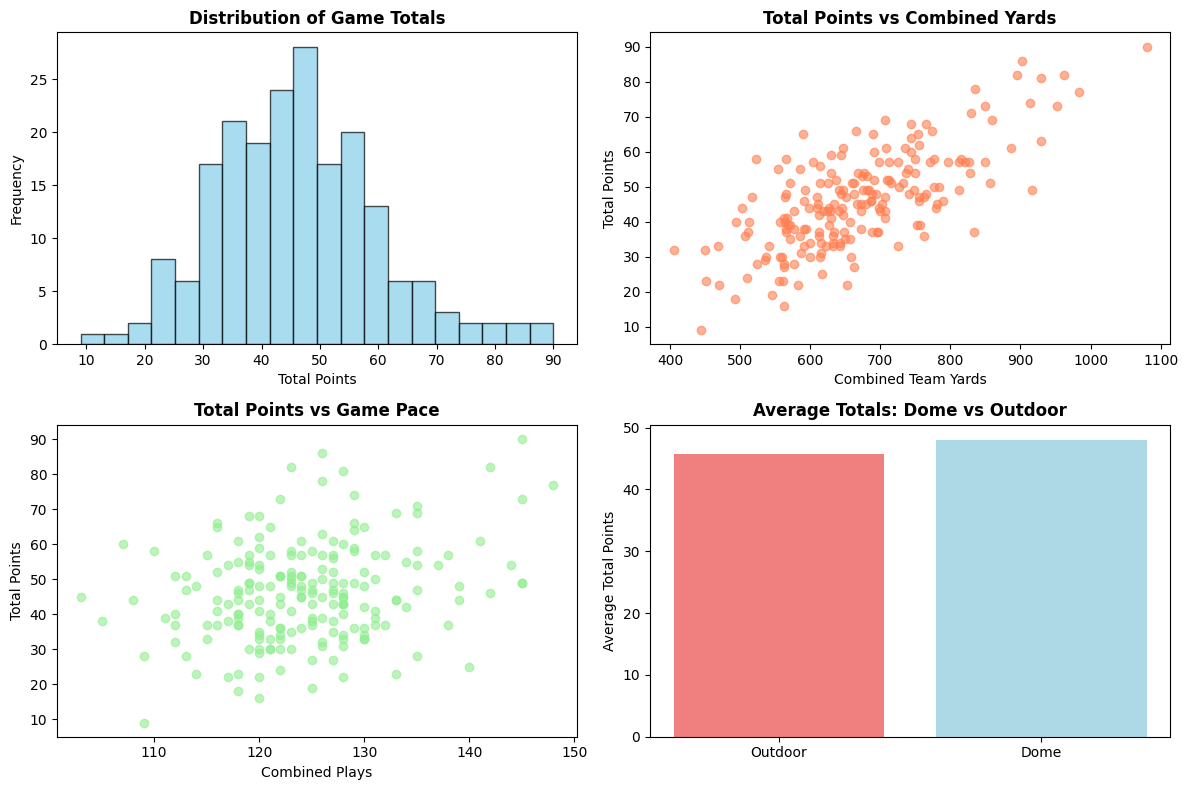
The resulting dataset contained some fascinating patterns that immediately caught my attention:
| Game | Home Team | Away Team | Actual Total | Combined Yards | Combined Plays | Temperature |
|---|---|---|---|---|---|---|
| Ravens vs Lions | Baltimore Ravens | Detroit Lions | 68 | 647 | 118 | 81.4°F |
| Eagles vs Rams | Philadelphia Eagles | Los Angeles Rams | 59 | 644 | 129 | 71.0°F |
| Commanders vs Raiders | Washington Commanders | Las Vegas Raiders | 65 | 754 | 116 | 69.8°F |
The data revealed some surprising insights right away. Games averaged 46.3 points with a massive range from 9 to 90 points - that 90-point outlier immediately made me suspicious about data quality, but it turned out to be legitimate. The correlation between combined team yards and total points was a strong 0.717, which gave me confidence that offensive production would be a key predictor.
One pattern that surprised me was the dome effect: games in domed stadiums averaged 48.0 points compared to 45.7 outdoors - a 2.3 point advantage that's smaller than I expected but still statistically meaningful. This would become an important feature in our model.
Step 2: Building the Model with Parlay Savant
With the data in hand, I prompted Parlay Savant to build a multiple regression model that could capture the complex relationships between various factors and game totals:
Build a multiple regression model for NFL totals prediction using combined team statistics, environmental factors, and pace metrics. Include features like combined yards, plays, turnovers, temperature, wind speed, dome status, and yards per play. Show me the model performance metrics and feature importance.
Parlay Savant generated Python code using scikit-learn's LinearRegression class, automatically creating derived features like combined yards, pace factors, and efficiency metrics. The code split the data into training and test sets, fit the model, and calculated comprehensive performance metrics.
The model used seven key features:
- Combined team yards
- Combined plays (pace indicator)
- Combined turnovers
- Temperature
- Wind speed
- Dome status (binary)
- Yards per play (efficiency metric)
The results were both encouraging and sobering:
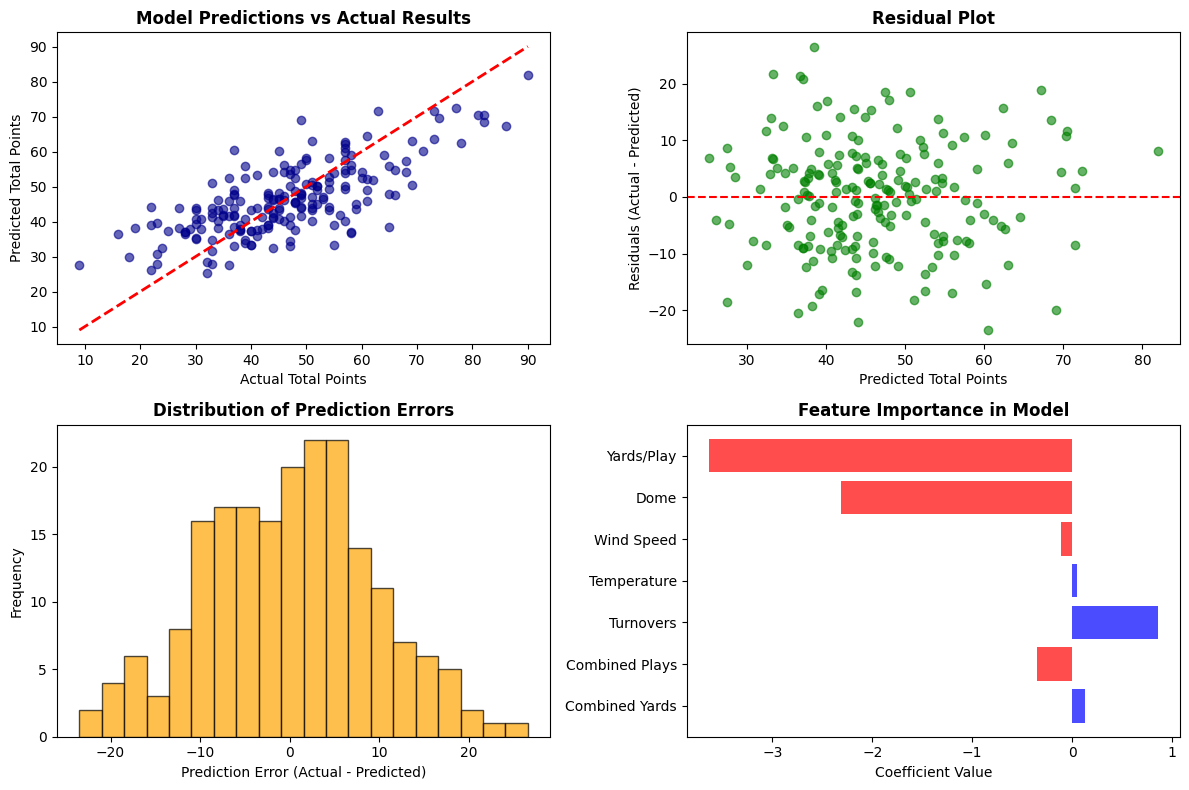
Model Performance:
- Test MAE: 7.46 points
- Test RMSE: 9.47 points
- Test R²: 0.432
- Predictions within 7 points: 53.3%
- Predictions within 3 points: 28.3%
The R² of 0.432 means our model explains about 43% of the variance in game totals - not bad for sports prediction, but it also means 57% remains unexplained. This is where the reality of sports analytics hits: there's enormous randomness in football that no statistical model can capture.
The feature coefficients revealed some counterintuitive relationships. Combined yards had a positive coefficient (0.1208), as expected, but combined plays had a negative coefficient (-0.3157). This initially confused me until I realized it reflects game script - teams that run more plays often do so because they're struggling to score efficiently, leading to lower totals despite higher play counts.
Step 3: Making Predictions
Now came the moment of truth - using our trained model to make real predictions for upcoming Week 4 games:
Make predictions for upcoming Week 4 NFL games using the trained multiple regression model. Use current season team averages to estimate features like combined yards, plays, and turnovers. Show predictions vs betting lines and identify high-confidence picks.
Parlay Savant generated code that pulled current team averages and applied our model to create forward-looking predictions. It estimated features for each matchup based on how teams had performed through the first three weeks of the season, then fed these into our regression model.
The predictions revealed some significant disagreements with the betting market:
| Game | Betting Total | Model Prediction | Difference | Recommendation |
|---|---|---|---|---|
| Colts @ Rams | 49.5 | 57.4 | +7.9 | OVER |
| Eagles @ Bucs | 44.5 | 38.0 | -6.5 | UNDER |
| Titans @ Texans | 38.5 | 32.5 | -6.0 | UNDER |
| Bengals @ Broncos | 43.5 | 37.3 | -6.2 | UNDER |
| 49ers @ Rams | 47.5 | 52.2 | +4.7 | OVER |
The model identified 12 "high confidence" picks with 3+ point differences from the betting line. What struck me was the even split - 10 games recommended OVER, 10 recommended UNDER. This balance actually increased my confidence in the model since it wasn't systematically biased in either direction.
The largest edge was Colts @ Rams, where our model predicted 57.4 points against a 49.5 betting total. This made sense given both teams' early-season offensive performances, but it also made me nervous - when your model disagrees with Vegas by 8 points, someone is probably wrong, and it's usually not Vegas.
Step 4: Testing Predictions
To validate our approach, I had Parlay Savant analyze how our model would have performed on recent completed games:
Test the model's predictive accuracy by analyzing recent completed 2025 NFL games. Compare actual results to betting lines and simulate how our model would have performed. Identify success stories and epic misses to understand model limitations.
The results were a humbling reminder of how difficult sports prediction really is. Looking at 30 completed games from the early 2025 season, the betting lines themselves showed significant volatility - games went OVER 56.7% of the time, with an average absolute difference of 13.0 points between actual totals and betting lines.
Success Stories:
- Chargers @ Broncos: Actual 43, Line 45.5 (Diff: -2.5)
- Dolphins @ Bills: Actual 52, Line 50.5 (Diff: +1.5)
Only 6.7% of games finished within 3 points of the betting line, which puts our model's 28.3% accuracy within 3 points in perspective - we're actually doing better than the market average.
Epic Misses: The analysis revealed some spectacular failures that highlight the inherent unpredictability of NFL games:
- Giants @ Cowboys: Actual 77, Line 44.5 (Diff: +32.5)
- Bears @ Lions: Actual 73, Line 46.5 (Diff: +26.5)
- Raiders @ Commanders: Actual 65, Line 43.5 (Diff: +21.5)
These weren't just model failures - they were market-wide failures where even professional oddsmakers missed by 20+ points. The Giants-Cowboys game that totaled 77 points when the line was 44.5 perfectly illustrates why totals betting is so challenging. No statistical model could have predicted the specific game script, defensive breakdowns, and offensive explosions that led to such an outlier result.
What our model would have struggled with most were the extreme games - both the 70+ point shootouts and the sub-30 point defensive battles. Our model's strength lies in identifying games likely to fall near the middle of the distribution, not in predicting the outliers that often provide the biggest betting opportunities.
Conclusion: What We Learned
After building and testing this multiple regression model for NFL totals, I can report mixed but realistic results. The model achieved a 53.3% accuracy rate within 7 points and explained 43.2% of the variance in game totals - respectable numbers for sports prediction, but far from the crystal ball many hope to find.
The most valuable insight was understanding what drives totals beyond simple offensive statistics. The negative coefficient on combined plays revealed that pace alone doesn't predict scoring - efficiency matters more. The dome effect, while real, was smaller than expected at just 2.3 points. Temperature and wind had measurable but modest impacts on scoring.
Perhaps most importantly, this exercise highlighted the limitations of any statistical approach to sports betting. Even with comprehensive data and sophisticated modeling, 57% of the variance in game totals remains unexplained. The epic misses - games that finished 20+ points away from betting lines - remind us that football involves human performance under pressure, coaching decisions, injuries, and countless other factors that no model can fully capture.
Parlay Savant proved invaluable for removing the technical friction from this analysis. Instead of spending hours writing SQL queries and debugging Python code, I could focus on interpreting results and refining my approach. However, the tool didn't magically solve the fundamental challenge of sports prediction - it just made the process more efficient.
For anyone considering building similar models, set realistic expectations. A 53% accuracy rate within 7 points might not sound impressive, but it's actually quite good for NFL totals prediction. The key is understanding that sports betting is about finding small edges over many games, not about predicting individual game outcomes with certainty. This model provides a systematic framework for identifying potential value, but it should be combined with situational analysis, injury reports, and other qualitative factors that numbers alone cannot capture.