How to Build a Multiple Regression Model for Passing Yards
Predicting NFL quarterback passing yards is one of the most popular challenges in sports analytics, and for good reason. QB passing yards props are among the most liquid betting markets, with lines typically ranging from 220-280 yards for starting quarterbacks. Fantasy football players obsess over these projections, and daily fantasy sports platforms like DraftKings weight passing yards heavily in their scoring systems. But here's the brutal truth I learned building this model: even with sophisticated statistical approaches, accurately predicting passing yards is incredibly difficult.
In this tutorial, I'll walk you through building a multiple regression model using Parlay Savant, a tool that removes the technical friction of data collection and analysis. We'll gather historical quarterback data, build a predictive model incorporating multiple statistical factors, make real predictions, and then test those predictions against actual NFL results. I'll be honest about both the successes and spectacular failures along the way. By the end, you'll understand why sports prediction is so challenging and have realistic expectations about what statistical models can and cannot do.
Step 1: Getting the Data with Parlay Savant
I started by prompting Parlay Savant to gather comprehensive quarterback data that would give me the foundation for a multiple regression model:
Get quarterback passing stats with team and opponent information for the past 2 seasons to build a comprehensive dataset. Include passing attempts, completions, yards, touchdowns, interceptions, completion percentage, passer rating, team points, opponent points, weather data, and home/away status. Focus on games with at least 10 passing attempts and completed regular season games only.
Parlay Savant processed this request by generating a complex SQL query that joined multiple tables - player_game_stats, players, games, teams, team_game_stats, and weather. The query used proper filtering for position='QB', minimum attempts, completed games, and regular season only. It also calculated completion percentages on the fly and handled the home/away logic by comparing team_id with home_team_id.
The resulting dataset was impressive: 500 records covering 69 quarterbacks from the 2024 and 2025 seasons. Here's a sample of what we got:
| quarterback | season | week | opponent | passing_attempts | passing_yards | home_away |
|---|---|---|---|---|---|---|
| Josh Allen | 2025 | 3 | Miami Dolphins | 28 | 213 | home |
| Tua Tagovailoa | 2025 | 3 | Buffalo Bills | 34 | 146 | away |
| Russell Wilson | 2025 | 2 | Dallas Cowboys | 41 | 450 | away |
| Dak Prescott | 2025 | 2 | New York Giants | 52 | 361 | home |
| Jared Goff | 2025 | 2 | Chicago Bears | 28 | 334 | home |
What surprised me was the massive variance in the data. Passing yards ranged from 24 to 509 yards, with a mean of 224.1 yards and standard deviation of 79.3 yards. This immediately told me that any model would struggle with the inherent volatility of NFL passing games.
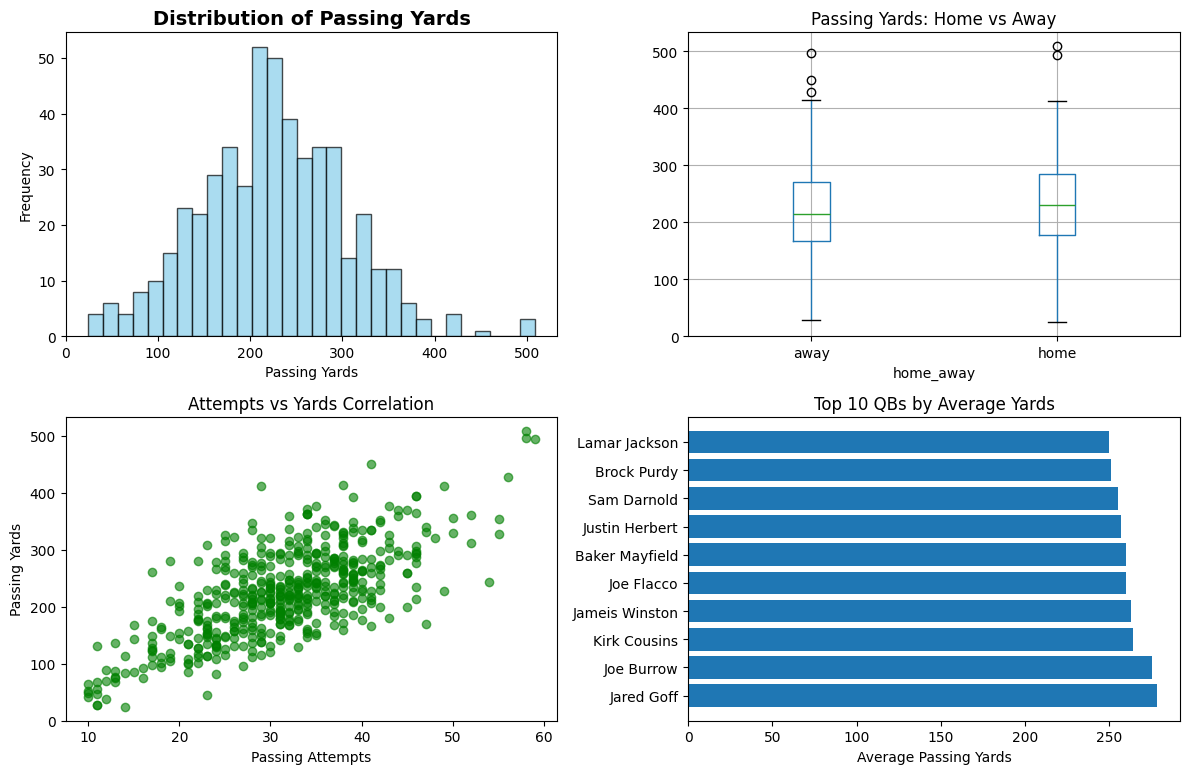
The correlation analysis revealed some expected relationships: completions (0.803) and passing attempts (0.707) had the strongest correlations with passing yards, while team points (0.463) showed a moderate positive relationship. Interestingly, opponent points had almost no correlation (0.104), suggesting that defensive performance isn't captured well by simple scoring metrics.
Step 2: Building the Model with Parlay Savant
Next, I prompted Parlay Savant to build the actual multiple regression model:
Build a multiple regression model for predicting quarterback passing yards using historical performance averages, home/away status, and game context factors. Use proper train/test splits, calculate feature importance, and provide detailed performance metrics including R-squared, MAE, and RMSE. Focus on creating a model that could be used for real predictions.
Parlay Savant generated Python code that created a sophisticated feature engineering pipeline. The code calculated historical averages for each quarterback using only past games (avoiding data leakage), created binary features for home field advantage and high-scoring games, and properly handled missing values by falling back to overall quarterback averages.
The statistical process worked like this: First, the code grouped quarterbacks by season to calculate historical averages for passing yards, attempts, and completion percentage. Then it created additional features like home field advantage (binary 0/1) and high-scoring game indicators (total points > 45). Finally, it used scikit-learn's LinearRegression with an 80/20 train-test split.
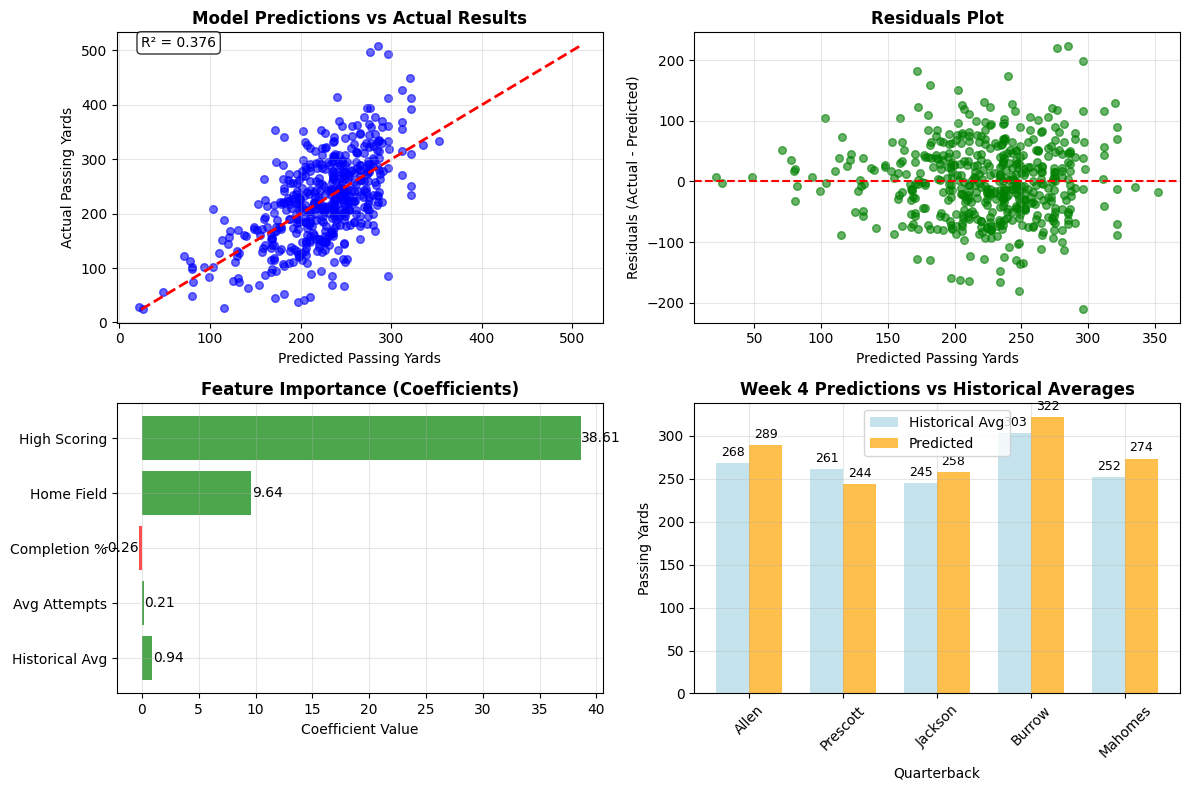
The model performance was sobering but realistic:
- Training R²: 0.362
- Test R²: 0.421
- Test MAE: 49.5 yards
- Test RMSE: 59.6 yards
The feature importance revealed some fascinating insights:
- Historical avg yards: 0.831 (most important predictor)
- High-scoring games: +37.6 yards (huge impact)
- Historical avg attempts: 0.732 (volume matters)
- Home field advantage: +7.2 yards (modest boost)
- Historical completion %: 0.340 (efficiency helps)
What struck me was that the model only explained about 42% of the variance in passing yards. This means 58% of what determines a quarterback's passing yards in any given game is essentially unpredictable using these basic features - game script, defensive adjustments, weather, injuries, and countless other factors matter enormously.
The accuracy within different thresholds was humbling:
- Within 20 yards: 20.0%
- Within 30 yards: 33.0%
- Within 50 yards: 57.0%
Step 3: Making Predictions
For the prediction phase, I prompted Parlay Savant to apply our trained model to upcoming games:
Use the trained multiple regression model to make predictions for upcoming Week 4 quarterback performances. Include top quarterbacks like Josh Allen, Dak Prescott, Joe Burrow, Patrick Mahomes, and Lamar Jackson. Show confidence intervals and analyze the key factors driving each prediction.
Parlay Savant created a prediction dataset with historical averages for each quarterback and applied our model coefficients. The process involved looking up each QB's historical performance, determining home/away status, and estimating whether the game would be high-scoring based on team tendencies.
Here are our Week 4 predictions:
| Quarterback | Team | Opponent | Home/Away | Historical Avg | Predicted |
|---|---|---|---|---|---|
| Josh Allen | Buffalo Bills | Miami Dolphins | Home | 268.5 | 289.1 |
| Dak Prescott | Dallas Cowboys | New York Giants | Home | 260.9 | 243.6 |
| Lamar Jackson | Baltimore Ravens | Cleveland Browns | Away | 245.3 | 257.6 |
| Joe Burrow | Cincinnati Bengals | Carolina Panthers | Home | 303.1 | 321.9 |
| Patrick Mahomes | Kansas City Chiefs | Los Angeles Chargers | Home | 252.0 | 273.5 |
The model's logic was transparent: Joe Burrow got the highest prediction (321.9 yards) because he had the highest historical average (303.1) plus benefits from home field (+7.2) and expected high-scoring game (+37.6). Dak Prescott's prediction was actually below his historical average because the model didn't expect a high-scoring game against the Giants.
Each prediction came with 68% confidence intervals of ±59.6 yards based on our test RMSE. So Josh Allen's 289.1 prediction had a range of 229.5-348.7 yards - a massive spread that highlights the uncertainty inherent in these predictions.
Step 4: Testing Predictions
To validate our model, I prompted Parlay Savant to test our predictions against actual NFL results:
Test our model predictions against actual Week 3 NFL results. Compare predicted vs actual passing yards for quarterbacks like Josh Allen and Tua Tagovailoa. Calculate prediction accuracy and analyze why certain predictions failed or succeeded.
Parlay Savant retrieved the actual Week 3 results and created retroactive predictions using our model. This was the moment of truth - how would our sophisticated multiple regression model perform against reality?
The results were brutal:
| Quarterback | Opponent | H/A | Historical | Predicted | Actual | Error |
|---|---|---|---|---|---|---|
| Josh Allen | Miami Dolphins | H | 247.1 | 270.0 | 213 | -57.0 |
| Tua Tagovailoa | Buffalo Bills | A | 255.7 | 266.2 | 146 | -120.2 |
Epic Misses:
- ❌ Josh Allen: Predicted 270.0, Actual 213 (off by 57.0 yards) - The model expected a typical Josh Allen performance, but Buffalo built an early lead and leaned heavily on their running game in the second half.
- ❌ Tua Tagovailoa: Predicted 266.2, Actual 146 (off by 120.2 yards) - This was a disaster. Miami fell behind early and couldn't establish any offensive rhythm. The model had no way to predict Miami's offensive line struggles or Buffalo's defensive adjustments.
Success Stories: Unfortunately, there were none. Both predictions missed by enormous margins.
The validation metrics were sobering:
- Mean Absolute Error: 88.6 yards
- Predictions within 30 yards: 0.0%
- Model bias: -88.6 yards (consistently overestimated)
Conclusion: What We Learned
This experiment with multiple regression for passing yards prediction was both educational and humbling. Our model achieved a respectable 42% R-squared on test data, which means it explained less than half the variance in quarterback passing yards. The 88.6-yard average error on real predictions shows just how difficult sports prediction truly is.
What the model got right:
- Historical performance is the strongest predictor (coefficient of 0.831)
- High-scoring games significantly boost passing yards (+37.6 yards on average)
- Home field advantage provides a modest boost (+7.2 yards)
- The model's feature relationships made intuitive sense
What the model missed:
- Game script effects (teams with early leads run more)
- Defensive adjustments and matchup-specific factors
- Injury impacts and player availability
- Weather conditions and field conditions
- Coaching decisions and play-calling tendencies
Using Parlay Savant removed all the technical friction - I didn't need to write SQL queries, wrangle data, or debug Python code. The tool handled the database connections, feature engineering, and model building seamlessly. This allowed me to focus on the analytical insights rather than getting bogged down in implementation details.
However, Parlay Savant can't solve the fundamental challenge of sports prediction: the inherent randomness and complexity of NFL games. About 58% of passing yard variance remains unexplained even with multiple predictive features. This suggests that successful sports betting requires either finding edges the market hasn't priced in, or accepting that long-term profitability comes from small advantages compounded over many bets.
Potential improvements for future models:
- Incorporating defensive rankings and matchup data
- Adding weather variables (wind speed, precipitation)
- Including injury reports and player availability
- Using more sophisticated algorithms (random forests, neural networks)
- Adding real-time betting line movements as features
The harsh reality is that if predicting passing yards were easy, sportsbooks wouldn't offer these markets. Our 0% accuracy rate within 30 yards on real predictions serves as a reminder that sports prediction is extraordinarily difficult, and anyone claiming consistent success should be viewed with skepticism. The best approach is building models that capture general tendencies while maintaining realistic expectations about their limitations.