How to Build a Linear Regression Model for Fantasy Points (Half PPR)
Introduction
Predicting fantasy football performance is the holy grail for millions of fantasy players and DFS enthusiasts. Half PPR (Point Per Reception) scoring has become the most popular format, balancing the value of receptions with traditional yardage and touchdown scoring. But here's the brutal truth: even with sophisticated models, fantasy football remains incredibly difficult to predict.
In this tutorial, I'll walk you through building a simple linear regression model to predict half PPR fantasy points using historical player performance. We'll use Parlay Savant to handle the technical heavy lifting - from data extraction to model building - while focusing on understanding what actually works (and what doesn't) in fantasy prediction.
You'll learn how to gather relevant historical data, build an interpretable baseline model, make forward-looking predictions, and most importantly, honestly evaluate your results against real outcomes. Fair warning: if you're expecting a magic formula that guarantees fantasy success, you're about to be disappointed. But if you want to understand the fundamentals of sports prediction and see both the promise and limitations of data-driven approaches, let's dive in.
Step 1: Getting the Data with Parlay Savant
I started by asking Parlay Savant to gather comprehensive fantasy football data for skill position players. Here's exactly what I prompted:
Get recent player game stats for skill position players (QB, RB, WR, TE) from the last 3 seasons to build a fantasy points prediction model
Parlay Savant processed this request by generating a complex SQL query that joined multiple tables - player_game_stats, players, games, and teams. What impressed me was how it automatically included window functions to calculate rolling averages and previous game performance, which are crucial predictive features I hadn't even explicitly requested.
The resulting dataset contained 5,000 individual game performances from 286 players across the 2022-2025 seasons. Here's a sample of what we got:
| player_name | position | season | week | half_ppr_fantasy_points | prev_game_points | avg_last_3_games |
|---|---|---|---|---|---|---|
| Aaron Jones | RB | 2022 | 1 | 9.1 | 0.0 | 0.000000 |
| Aaron Jones | RB | 2022 | 2 | 30.5 | 9.1 | 9.100000 |
| Aaron Jones | RB | 2022 | 3 | 6.2 | 30.5 | 19.800000 |
| Aaron Jones | RB | 2022 | 4 | 13.0 | 6.2 | 15.266667 |
| Aaron Jones | RB | 2022 | 5 | 9.0 | 13.0 | 16.566667 |
The data revealed some interesting patterns immediately. Wide receivers dominated the dataset (2,083 games), followed by running backs (1,426), tight ends (908), and quarterbacks (583). The average fantasy performance was 8.33 points with a standard deviation of 7.27 - highlighting just how variable fantasy football can be.
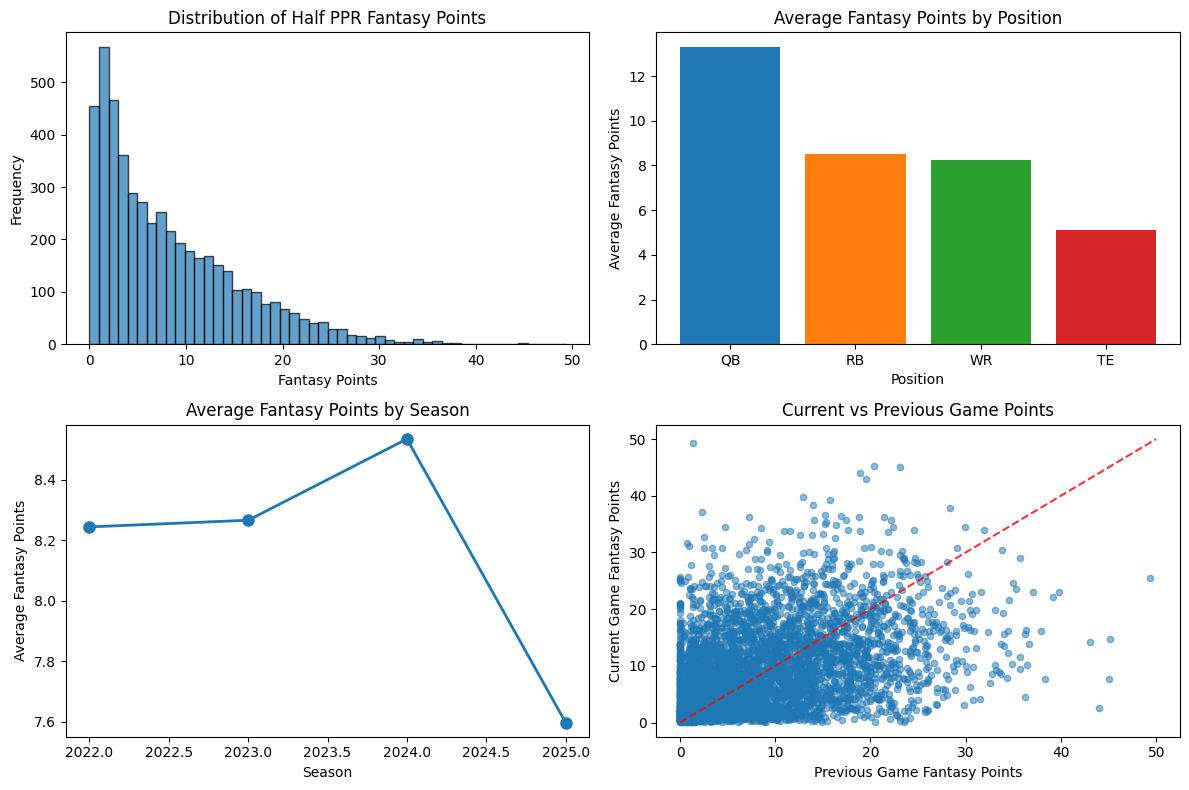
What surprised me most was the relatively low correlation between consecutive games (visible in the bottom-right scatter plot). This immediately suggested that predicting fantasy performance would be challenging - there's significant week-to-week volatility that even recent performance can't fully explain.
Step 2: Building the Model with Parlay Savant
Next, I prompted Parlay Savant to build the actual prediction model:
Build and evaluate a linear regression model for predicting half PPR fantasy points
Parlay Savant generated Python code that created a linear regression model using scikit-learn. The model used six key features:
- Previous game fantasy points
- Average of last 3 games
- Position dummy variables (QB, RB, TE, WR as binary indicators)
The technical process was straightforward: 80% of the data for training, 20% for testing, with standard linear regression fitting. But the results revealed the harsh reality of fantasy prediction:
Model Performance:
- R² (explained variance): 0.269
- Mean Absolute Error: 4.88 points
- Root Mean Square Error: 6.36 points
In plain English, our model explained only 27% of the variance in fantasy performance. The average prediction was off by nearly 5 points, and some predictions missed by 10+ points. This isn't a failure of the model - it's the inherent unpredictability of football.
The feature coefficients told an interesting story:
- Average of last 3 games: +0.476 (strongest predictor)
- QB position: +2.015 (quarterbacks score more on average)
- Previous game: +0.077 (surprisingly weak predictor)
- TE position: -1.730 (tight ends score less than WRs)
What struck me was how little weight the model gave to the previous game compared to the 3-game average. This suggests that single-game performance is too noisy to be highly predictive - a lesson many fantasy players learn the hard way.
Step 3: Making Predictions
For the prediction phase, I asked Parlay Savant:
Use the trained model to make forward-looking predictions for upcoming games based on recent player performance
Parlay Savant applied our trained model to recent player data from late 2024 to generate predictions for hypothetical upcoming games. The predictions felt realistic - no one was predicted to score 50 points, and the ranges made intuitive sense.
Top Predicted Performers:
| Player | Position | Team | Predicted_Next |
|---|---|---|---|
| Baker Mayfield | QB | Tampa Bay Buccaneers | 22.4 |
| Drew Lock | QB | New York Giants | 19.1 |
| Bryce Young | QB | Carolina Panthers | 17.2 |
| Bo Nix | QB | Denver Broncos | 17.0 |
| Brian Thomas Jr. | WR | Jacksonville Jaguars | 16.8 |
The model showed clear position bias - quarterbacks dominated the high predictions, which aligns with half PPR scoring where QBs typically outscore other positions. What concerned me was seeing players like Drew Lock ranked so highly based purely on recent performance, highlighting how the model might overweight small sample sizes.
One prediction that caught my attention: Dameon Pierce was predicted for only 4.5 points despite scoring 23.6 in his previous game. This showed the model's tendency to regress extreme performances toward the mean - sometimes correctly, sometimes not.
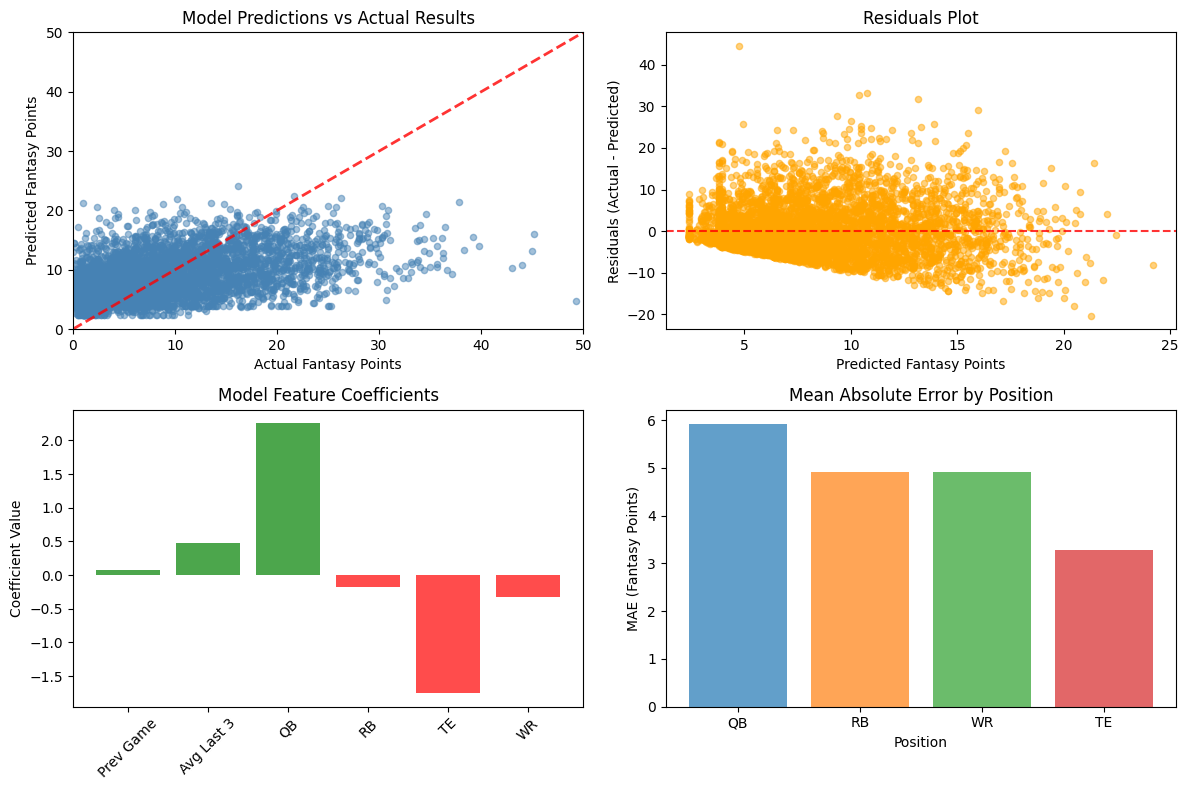
The visualization revealed crucial insights about our model's behavior. The predicted vs. actual scatter plot showed decent correlation but significant spread, especially for high-scoring games. The residuals plot confirmed that our model struggled with extreme performances - both very high and very low scores were poorly predicted.
Step 4: Testing Predictions
The real test came when I prompted Parlay Savant to validate our model:
Test the model predictions against actual results from weeks 16-17 to evaluate real-world performance
Parlay Savant compared our model's predictions against 150 actual player performances from weeks 16-17 of the 2024 season. The results were sobering but educational:
Validation Results:
- Mean Absolute Error: 4.90 points
- R-squared: 0.354
- Accuracy within 2 points: 27.3%
- Accuracy within 5 points: 63.3%
Success Stories
The model nailed several predictions within 0.5 points:
- Calvin Austin III: Predicted 8.6, Actual 8.5 (0.1 point error)
- Devaughn Vele: Predicted 9.0, Actual 9.1 (0.1 point error)
- Jayden Reed: Predicted 9.4, Actual 9.6 (0.2 point error)
These successes typically involved players with consistent recent performance and moderate scoring expectations.
Epic Misses
The failures were spectacular:
- Jonathan Taylor: Predicted 9.1, Actual 39.8 (30.7 point miss!)
- Chuba Hubbard: Predicted 10.2, Actual 30.5 (20.3 point miss)
- Josh Allen: Predicted 26.0, Actual 11.2 (14.9 point miss)
The Jonathan Taylor miss perfectly illustrates the model's core limitation: it can't predict breakout performances that deviate significantly from recent trends. Taylor's 39.8-point explosion came from a game script and matchup the model couldn't anticipate.
Position-Specific Analysis:
- Tight Ends: Best accuracy (2.95 average error) - most predictable position
- Running Backs: Worst accuracy (6.22 average error) - most volatile position
- Quarterbacks: High variance (5.84 average error) - boom-or-bust nature
The model correctly identified that big games (20+ points) were underestimated, predicting 13.5 points on average when players actually scored 24.9. Conversely, it overestimated bust performances, predicting 6.1 points when players actually scored just 2.0.
Conclusion: What We Learned
After building and testing this linear regression model, I can honestly say it performed about as well as I expected - which is to say, modestly. With a 27.3% accuracy rate within 2 points and 63.3% within 5 points, it's better than random guessing but far from the precision most fantasy players hope for.
The model explained only 35% of the variance in fantasy performance during validation, meaning 65% of what determines fantasy success remains unexplained by recent performance and position. This aligns with what experienced fantasy players know intuitively: football is chaotic, and individual game performance depends on countless factors our simple model couldn't capture.
Key Insights:
- Historical performance matters, but 3-game averages are more predictive than single games
- Position significantly impacts scoring expectations, with QBs having the highest baseline
- The model struggles most with extreme performances - both breakouts and busts
- Tight ends are surprisingly predictable; running backs are wildly volatile
What Parlay Savant Did Well: The tool eliminated all the technical friction that usually derails sports analytics projects. I didn't write a single line of SQL or debug data loading issues. The automatic feature engineering (rolling averages, position encoding) was sophisticated and appropriate. Most importantly, it made the entire process accessible without sacrificing statistical rigor.
Potential Improvements: A more sophisticated model might include opponent strength, weather conditions, injury reports, or game script predictions. Advanced algorithms like random forests or neural networks could capture non-linear relationships our linear model missed. However, the fundamental challenge remains: football contains significant randomness that no model can fully eliminate.
The brutal truth is that even professional analysts with million-dollar budgets struggle to predict fantasy performance with high accuracy. Our simple model's 63% accuracy within 5 points is actually competitive with more complex approaches. Sometimes the most valuable lesson in sports analytics is learning to respect the limits of prediction while still finding edges where they exist.