Sportsbooks move millions of dollars on NFL player props every week. They have to be accurate. So could you just use their lines to build fantasy rankings instead of relying on expert opinions?
I was getting dressed for a wedding when it hit me - I'm building an AI research tool for NFL and betting, and I already have all the player prop data organized. What if I used it to build fantasy rankings?
I had a 3.5 hour train ride to NJ for the wedding and planned to spend the entire time building this out and putting it on my site, Parlay Savant - an AI research tool for NFL and betting.
The betting odds do 95% of the heavy lifting - they're already predicting player performance. But there's still a little math to convert those odds into fantasy projections. Say Jalen Hurts is -110 to score a rushing touchdown - that's about 50/50 odds after removing the vig. But that's the odds he scores at least one touchdown. Since the bet cashes whether he scores 1, 2, or 3, his expected touchdowns is actually higher - around 0.64 using Poisson distribution math. Apply that logic across passing yards, receptions, rushing attempts, and you get fantasy projections.
After a little bit of engineering, the Vegas fantasy rankings were born and just from the eye test looked shockingly good.
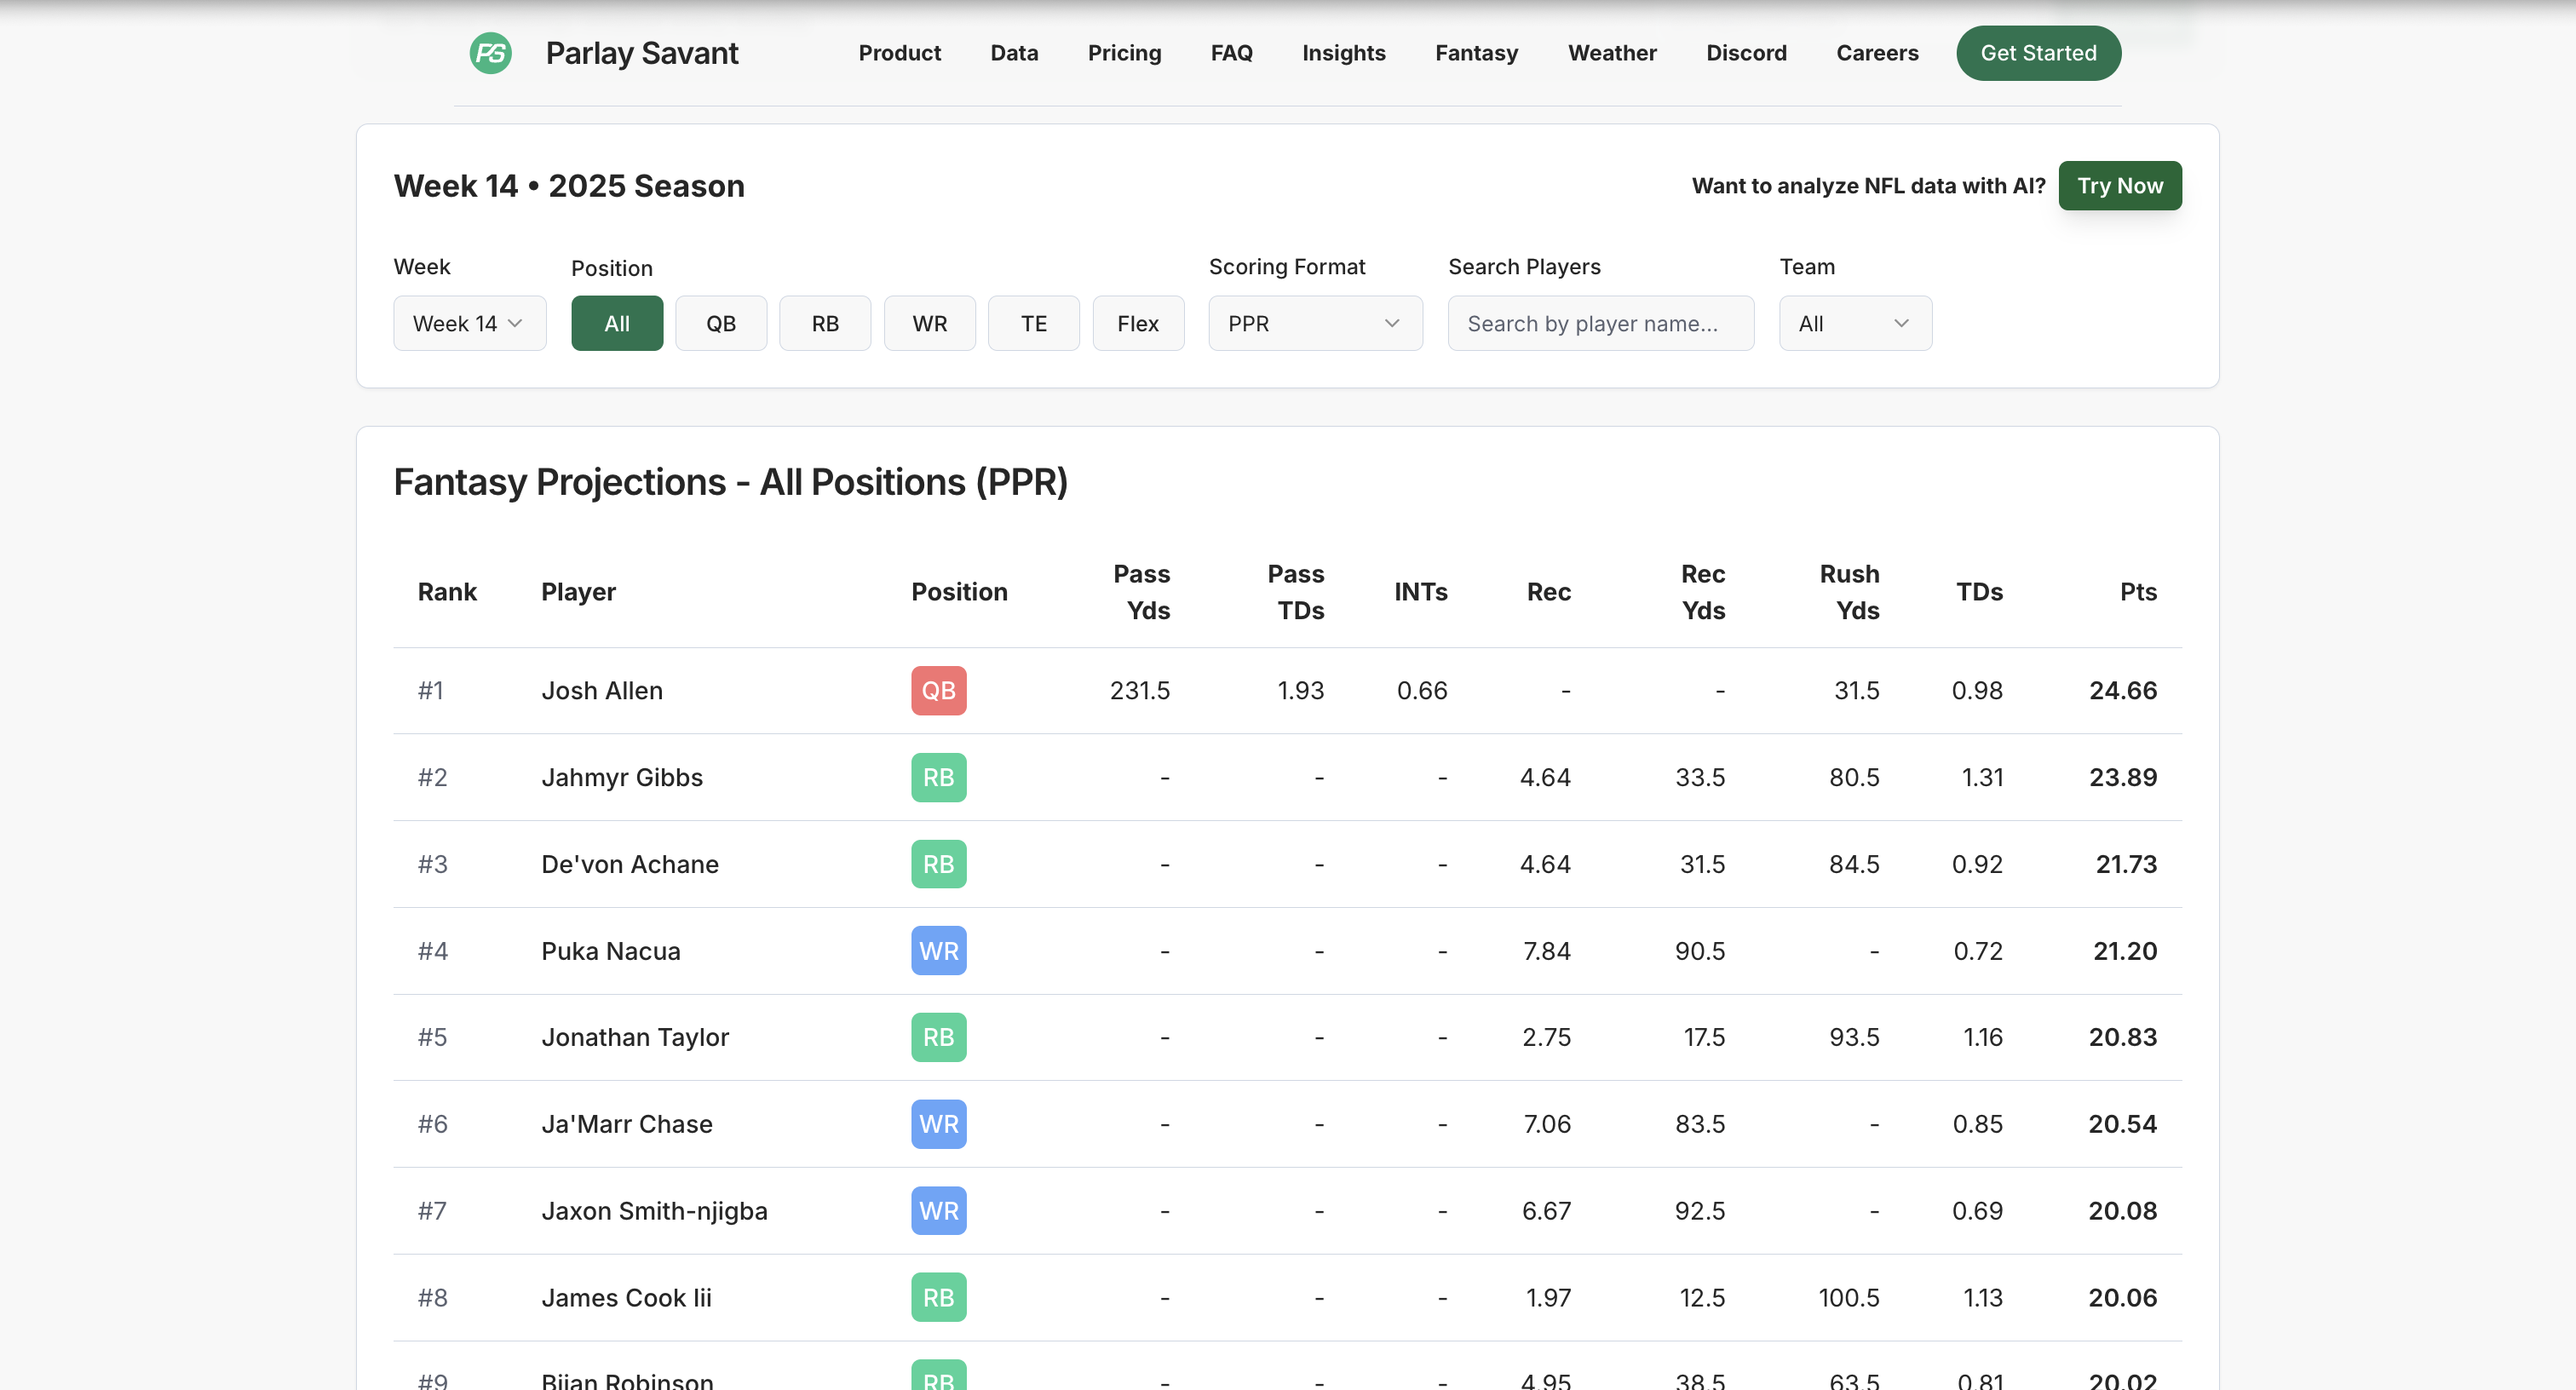 Vegas-based fantasy rankings - updated hourly at parlaysavant.com/fantasy/vegas-rankings
But the eye test isn't good enough. After I launched them, everyone asked: "Do they actually work compared to the best sites?" Here's my attempt to find out.
I compared Vegas rankings head-to-head against DraftSharks for the first 13 weeks of the 2025 NFL season.
Test 1: Projection Accuracy
I tested against DraftSharks since they had the easiest website to scrape. All data is publicly available - download the full CSV here. The first test was simple: how far were the projections from what actually happened? I measured this using MAE - which tracks how far off your projections were on average. If you said 15 points and a player scored 10, that's 5 points of error. MAE averages those errors across every player and every week. DraftSharks has three different projection systems. Parlay Savant was more accurate than all of them.
| Rank | System | MAE | Improvement |
|---|---|---|---|
| 1st | Parlay Savant | 4.76 | -- |
| 2nd | DraftSharks Main | 4.84 | +1.5% worse |
| 3rd | DraftSharks 3D | 5.05 | +5.6% worse |
| 4th | DraftSharks Consensus | 5.15 | +7.4% worse |
Parlay Savant was 0.3 points more accurate on average than DraftSharks' 3D projections (their default). Do the math: 0.3 points × 7 starters × 17 weeks = 34 extra points over a season. That's not nothing.
So Vegas wins, right? Pack it up, we're done here.
Not so fast. Projecting exact point totals is one thing. But fantasy players don't actually need to know if someone will score 15.3 or 14.8 points - they just need to know who to start. And that's a different test entirely.
Here's an example: imagine one ranking says every player will score 10 points too high, but ranks them in perfect order. Another ranking is within 5 points for everyone, but the order is completely random. You'd take the first one, right? Because when it says "start Player A over Player B," it's actually correct - even though the point totals are wrong.
Test 2: Top Player Identification
So I ran a different test. How often did each ranking correctly predict who the top performers would be? Like, if you rank someone as QB3 for the week, did they actually finish as a top-3 QB? This tests ranking order independent of exact point totals.
| Position | Tier | Parlay Savant | Draft Sharks | Advantage |
|---|---|---|---|---|
| QB | Top 6 | 38.5% | 33.3% | +5.1% |
| QB | Top 12 | 55.6% | 56.9% | -1.4% |
| QB | Top 18 | 70.2% | 71.7% | -1.5% |
| RB | Top 12 | 61.1% | 59.0% | +2.1% |
| RB | Top 24 | 73.8% | 72.9% | +0.8% |
| RB | Top 36 | 87.2% | 87.2% | 0.0% |
| WR | Top 12 | 43.1% | 42.4% | +0.7% |
| WR | Top 24 | 56.1% | 55.3% | +0.8% |
| WR | Top 36 | 65.6% | 65.8% | -0.3% |
| TE | Top 6 | 37.9% | 40.9% | -3.0% |
| TE | Top 12 | 48.3% | 48.3% | 0.0% |
| TE | Top 18 | 67.8% | 66.1% | +1.7% |
What's this showing? If you ranked 6 QBs as "top 6" each week, how many of them actually finished top 6? The percentages show accuracy rates. As the tiers get bigger (top 18 vs top 6), predictions get easier - hence the higher percentages.
Most of these are basically coin flips with small edges either way. The notable spots are the high-variance positions: Parlay Savant won on top-6 QBs (+5.1%) and top-12 RBs (+2.1%), while DraftSharks won on top-6 TEs (-3.0%). Overall? Pretty much a tie, with a slight edge to Vegas on the highest-value picks.
Test 3: Real-World Start/Sit Decisions
One more test - the one that actually matters. I wanted to test the decisions fantasy players stress over every week: should I start my RB2 or RB3? Which streaming QB should I grab? Who goes in my flex spot? Here's how each system performed on these real-world decisions:
| Decision Type | Range | Typical Points | Parlay Savant | Draft Sharks |
|---|---|---|---|---|
| QB Streaming | QB8-16 | 14.7-21.7 pts | 48.7% | 50.5% |
| RB2/RB3 | RB18-30 | 7.5-12.6 pts | 57.2% | 58.7% |
| WR2/WR3 | WR18-30 | 11.1-15.5 pts | 54.0% | 53.7% |
| TE Streaming | TE8-16 | 8.3-12.4 pts | 54.8% | 54.1% |
| Flex Plays | RB/WR/TE 35-55 | 12.0-15.9 pts | 57.0% | 56.3% |
These percentages show how often each system correctly picked the better player in head-to-head comparisons within each range. For example, if you compared every QB8-16 matchup (should I start QB10 or QB13?), you'd be right about 49-50% of the time with either system.
The takeaway? Everything is basically a coin flip. It's incredibly hard to predict whether QB10 or QB14 will have the better week - that's just NFL variance. Both systems are hovering right around 50-50 on most decisions, with tiny edges either way. DraftSharks has a slight edge on RB2/RB3 decisions, while Parlay Savant has a slight edge on WR2/WR3 and flex plays.
Bottom line: for the tough weekly decisions that actually keep you up at night, neither system has a meaningful advantage.
The Bottom Line
Vegas fantasy rankings work. Parlay Savant tied DraftSharks (one of the sharpest fantasy sites around) on pure rankings and dramatically outperformed on predicting fantasy points. Both DraftSharks and Parlay Savant will beat the default rankings on ESPN and Sleeper by a good margin.
The big advantage? Vegas lines update automatically. Parlay Savant's rankings update every hour based on live betting markets, which means they respond to injury news and line movement way faster than any traditional fantasy site.
When to use it: Parlay Savant is most accurate close to gametime when Vegas has set full lines on all players. For Sunday and Monday games, this works great - you can check rankings right up until kickoff. For Thursday night games, it's trickier. Some player props don't go live until Wednesday or Thursday morning, so if you need to set lineups early in the week, you might be working with incomplete data.
Best practice: Check the rankings Thursday morning for TNF players, then again Sunday morning for your full lineup.
Try the live rankings: parlaysavant.com/fantasy/vegas-rankings
Main site: parlaysavant.com
Download the data: Full CSV dataset
Follow my X Account: @RuvenKotz
Get More Insights Like This
Data-driven betting analysis delivered to your inbox weekly